
Page 125 - PortalToEnglish_4_SB_SE
P. 125
1 B Look at the line graphs again and answer the questions below.
1. What is shown along the bottom (the x axis)?
80
70 2. What is shown along the side (the y axis)?
60 3. Which words in the paragraphs describe how the rhino
50 populations have changed?
40
30
20
10
0
1960 1980 2018
2
800
600
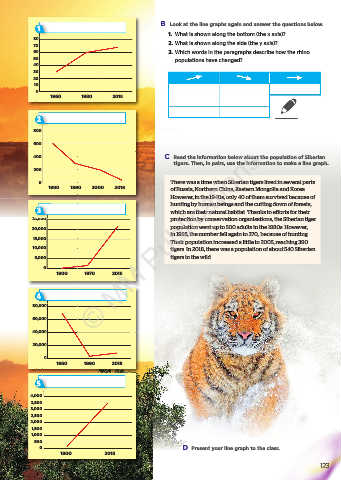
400 C Read the information below about the population of Siberian
tigers. Then, in pairs, use the information to make a line graph.
200
0 There was a time when Siberian tigers lived in several parts
1980 1990 2000 2018
of Russia, Northern China, Eastern Mongolia and Korea.
However, in the 1940s, only 40 of them survived because of
hunting by human beings and the cutting down of forests,
3 which are their natural habitat. Thanks to efforts for their
5
000
,
25,000 protection by conservation organisations, the Siberian tiger
2
20,000 population went up to 500 adults in the 1980s. However,
in 1995, the number fell again to 370, because of hunting.
15,000 © MM Publications
Their population increased a little in 2005, reaching 390
10,000 tigers. In 2018, there was a population of about 540 Siberian
5,000 tigers in the wild.
0
1900 1970 2018
4
80,000
60,000
40,000
20,000
0
1960 1990 2018
5
4,000
3,500
3,000
2,500
2,000
1,500
1,000
500
0 D Present your line graph to the class.
1900 2018
123
6/4/2020 1:20:18 µµ
119-128_PortalToEnglish4_SB_SERBIA_Tasks_Culture.indd 123
119-128_PortalToEnglish4_SB_SERBIA_Tasks_Culture.indd 123 6/4/2020 1:20:18 µµ