
Page 110 - WorldWatchers_3_SB_DEMO
P. 110
CLIL 1 Maths
B ar G ra p h s
Bar Graphs
A. Look at the highlighted words in the text and find C. Look at the bar graph in activity B
their definitions in a dictionary. and answer the questions.
B. What do you know about bar graphs? Listen, 1. What is the topic of the survey?
read and find out more. 2. How many students are there in
Bar graphs or bar charts are drawings that organise Steven’s class?
and compare data. Each bar graph has a title for 3. What does the x-axis show?
the topic of the survey. There are two axes in every
bar graph; the vertical axis is called the y-axis, and D. The table below shows the results of
the horizontal axis is called the x-axis. The y-axis class 7B’s survey on sports. Answer
usually shows the amount or number of something. questions 1-4 and make a bar graph
This axis is also called the scale. The x-axis shows with the information.
the di ferent categories of data we are comparing. NUMBER OF
Bars of di ferent sizes and colours are used to show FAVOURITE SPORT STUDENTS
the data. Bar graphs are very useful because they water polo 4
help us to understand information more easily. For
example, take a look at this graph, which a student handball 10
made. Then, read how he presents the information ice hockey 1
in the bar graph. snowboarding 3
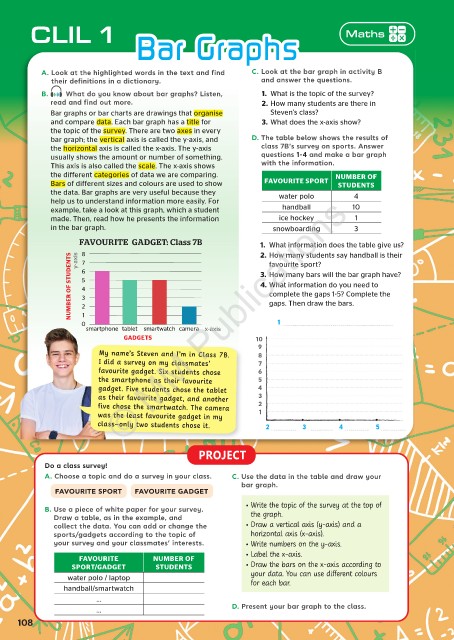
FAVOURITE GADGET: Class 7B 1. What information does the table give us?
8
2. How many students say handball is their
y-axis
NUMBER OF STUDENTS 6 5 4 3 3. How many bars will the bar graph have?
7
favourite sport?
4. What information do you need to
complete the gaps 1 5? Complete the
gaps. Then draw the bars.
1
0 2 1 © MM Publications
smartphone tablet smartwatch camera x-axis
GADGETS 10
9
My name’s Steven and I’m in Class 7B. 8
My name’s Steven and I’m in Class 7B.
I did a survey on my classmates’ 70
favourite gadget. Six students chose 6
the smartphone as their favourite 5
gadget. Five students chose the tablet 4
as their favourite gadget, and another 3
five chose the smartwatch. The camera 2
1
was the least favourite gadget in my
class–only two students chose it. 2 3 4 5
PROJECT
Do a class survey!
A. Choose a topic and do a survey in your class. C. Use the data in the table and draw your
bar graph.
FAVOURITE SPORT FAVOURITE GADGET
• Write the topic of the survey at the top of
B. Use a piece of white paper for your survey.
Draw a table, as in the example, and the graph.
collect the data. You can add or change the • Draw a vertical axis (y-axis) and a
sports/gadgets according to the topic of horizontal axis (x-axis).
your survey and your classmates’ interests. • Write numbers on the y-axis.
• Label the x-axis.
FAVOURITE NUMBER OF
SPORT/GADGET STUDENTS • Draw the bars on the x-axis according to
water polo / laptop your data. You can use different colours
for each bar.
handball/smartwatch
...
D. Present your bar graph to the class.
...
108
108
20/5/2024 12:18:41 µµ
BOOK_WW 3_SB_SRB.indb 108 20/5/2024 12:18:41 µµ
BOOK_WW 3_SB_SRB.indb 108